Tables are quite intuitive for presenting data with a group of figures for they show the precise values; however, if you want to figure out the trends and patterns, charts with intuitive visuals like bars, lines, and pictures are much more helpful. Instead of creating charts manually, an AI chart generator is truly what you need.

Now just move on to reading and explore the 4 best AI chart creators. All detailed introductions, features, pros, and cons are included.
- On This Page
- What Is an AI Chart Generator
- The Best AI Chart Generators
- Bonus: Presente Your Data with Well-Structured Slides
What Is an AI Chart Generator
AI chart generator, also known as AI graph maker, is an AI tool that creates graphs from your data: values, documents, and sometimes prompts. The graph makers will analyze the uploaded data, figure out the relations between the values, and suggest how to present the data efficiently.
Anyone who needs to present data in an insightful way can use AI graph generators, whether you are a business marketer, researcher, educator, or student.
The Best AI Chart Generators
With just a few simple clicks, you can easily create intuitive visuals to present your data smartly. This article has rounded up 4 top AI chart generators that target different users’ needs. Just check the details and find one that suits you.
Venngage - AI Graph Maker from Prompts to Make Complete Presentations
Venngage is one of the top AI chart generators that you can rely on. Its intuitive data visualization and eye-pleasing designs will never let you down if you are to create AI charts for your presentations. All the charts stats, elements, text, and layouts are all editable. You might as well add some personal touch and adjustment to your charts and pres.

Key Feature
-
Come with templates, charts, elements, shapes, and maps to create a complete presentation with clear data visualization.
- Support generating well-designed AI charts from text prompts and further editing/customizing your AI charts.
- Ready-made and easy-to-edit charts: tables, pies, columns, bars, lines, areas, scatters, hierarchical charts, etc.
- Offer an AI writer feature to rewrite your data and chart descriptions.
Pros
- Free credits before signing up.
- Provide inbuilt AI background remover to remove unwanted objects from your photos.
- Provide an AI Branding feature to apply your brand color.
Cons
- Many useful features are locked behind the paywall and require subscriptions.

GraphMaker - Chatable AI Chart Generator from Files
GraphMaker will be very suitable for you if you are just to analyze your documents with intuitive and visualized graphs. This AI chatbot will help you convert unreadable documents into easy-to-understand charts. What’s more, users also love this easy and light AI graph maker because it supports directly analyzing Google Sheets. Just connect your Google account and insert the sheet link, and you can get an in-depth breakdown.

Key Feature
-
Chatable AI graph maker to visualize your data and research.
-
Support generating multiple types of AI charts, pie charts, bar charts, scatter plots, line graphs, etc.
- Provide Google Sheets data visualization and also CSV files from local drives.
- Support dragging the chart to zoom in and check the detailed data.
Pros
- Easy to use interface.
- Quick data analysis and processing.
- Free AI graph generator.
Cons
- No further editing options.

Piktochart - AI Chart Generator for Index Analysis Report
Piktochart AI ranks high as well due to its complete index analysis report creation. This AI chart maker, similar to Venngage, will generate a complete and ready-to-use data report with comprehensive and well-organized AI graphs. Besides AI charts, this app also features creating newsletters, lists, comparisons, timelines, and any other prints with data visuals.

Key Feature
-
AI chart generator from text generates a whole data analysis report full of readable charts.
-
Offer a handful of AI graphs: columns, dots, bubbles, donuts, radial bars, icon matrix, venns, etc.
- Provide diverse design component templates for comparisons, lists, photo grids, timelines, etc.
Cons
- Only 2 credits for free users.

Julius AI Graph Maker for Indepth Data Analysis
Julius AI will be of great help to those who have challenges in reading/learning study materials. This AI graph generator is a great choice for indepth and radical data analysis. With its pre-made workflows, students and researchers don’t need to throw a large amount of time into understanding/learning the material page by page.

Key Feature
-
Chat-able free AI chart generator that is suitable for indepth data analysis and visualization.
-
Provide prepared workflows: Data Processing/Visualization/Cleaning, Statistics, Significance Testing, Time Series Analysis, etc.
- Provide editable Python code and understandable explanations to the “actions” of every step.
Pros
- Very deep and insightful data analysis and visualization.
- Pre-made workflows to promote your work efficiency.
Cons
- The generated chart is not editable, which makes this AI graph maker more suitable for generating AI charts for learning but not creating.
- May be challenging for green hands to learn and use this tool.

Bonus: Presente Your Data with Well-Structured Slides
The above AI chart generators all do a great help in data visualization with intuitive charts, helping you comprehend the learning material, create reports, or do in-depth research. Many students, businessmen, researchers, and marketers will need this analysis for their presentations.
With all the data in your hand, how do you convey your report and idea to the audience in an organized way? Just turn to an AI slide generator! Vidwud AI PowerPoint Generator will be your firm helper to generate a complete and persuasive and well-structured slide.
Free AI Presentation Maker - Text to PPT
-
Easy and free prompt-to-slideshow generator
-
Multiple themes & templates for beautiful PPT creation
- Perfect online slideshow for school project, business pitch, etc.
Make AI Presentation Now
How to Create Organized Slides to Present Your Data?
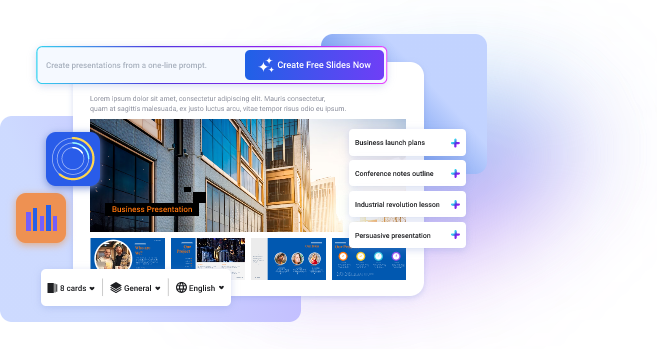
Step 1. Click the button below and access this useful app. All you need to do is to input your idea and click Create Free Slides Now.
Make AI Presentation Now
This free AI slides maker will instantly analyze your prompt and generate a coherent and persuasive layout.

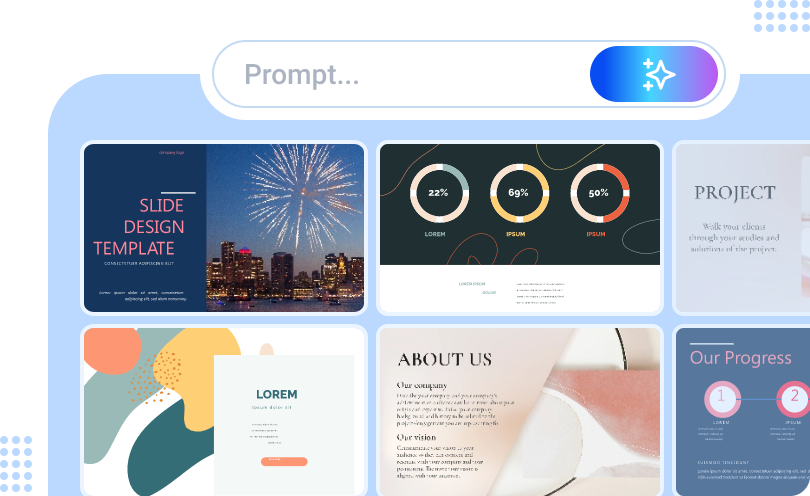
Step 2. Choose a theme for presenting your data and AI charts.

Step 3. Add your content like data and AI charts to the slides and download/share. With the AI slides generator from text, you can save a large amount of time and now focus on your speech.

Conclusion
Instead of trying so hard to understand the material or crafting charts and tables manually, we would better use an AI chart generator to generate an intuitive chart. Just in 1 click, you can visualize your data and get a detailed breakdown easily.
Moreover, if you need to present your data with all the AI charts you made, don’t hesitate to use Vidwud AI PowerPoint Generator and create AI slides in a snap!