Illustrating a project schedule, Gantt charts allow you to track a project's progress visually. Project managers widely use Gantt charts today because they visually organize tasks, deadlines, and progress. Project teams can also communicate and collaborate effectively using Gantt charts.
How to make a Gantt chart? PowerPoint can be the best tool that comes in handy, and you can find specific steps later. By the end, you will know how to make a Gantt chart in PowerPoint and find the best AI tool to make slides efficiently.

- On This Page
- What is a Gantt Chart?
- Why Make a Gantt Chart in PowerPoint?
- How to Make a Gantt Chart in PowerPoint?
- How to Create a Presentation with Gantt Chart via AI?
What is a Gantt Chart?
At first glance, a Gantt chart looks like a bar chart. You can see it visually display project schedules and progress using bars. Consider a Gantt chart as a timeline sheet that shows the list of tasks in the project, the schedules (start and end dates), mile milestones, interdependencies, and responsible individuals.
With Gantt charts, you can have a visual overview of planning, scheduling, and resource allocation. Of all the project management tools out there, Gantt charts are known for their value in improving productivity.
Why Make a Gantt Chart in PowerPoint?
While project management programs allow you to create a Gantt chart, there might be a steep learning curve that takes too much effort. Today, PowerPoint remains the most popular way to create a Gantt chart. Here are the reasons why you should create a Gantt chart in PowerPoint:
-
Presentation-friendly format: There is no need to transfer a Gantt chart from one program to another; a Gantt chart created in PowerPoint is ready to present at any time.
-
Easy to understand: PowerPoint has been around for ages. Most people are likely to be familiar with it, making it easier to make a Gantt chart in PowerPoint.
- High level of customization: PowerPoint comes with full customization options. You can fully control the design and layout of your Gantt chart.
- Quick sharing: PPT/PPTX file is easy to share within your teams. You can share the Gantt chart via email or USB or upload it to social media quickly.
How to Make a Gantt Chart in PowerPoint?
Microsoft PowerPoint continues to evolve by incorporating more features for productivity. You can easily create a Gantt chart with a few clicks. Just read on to see how to make a Gantt chart in PowerPoint with 2 useful methods.
How to Create a Gantt Chart in PowerPoint Manually via Table Function
How do I create a Gantt chart in PowerPoint? PowerPoint has a Table function that allows you to build tables and display data. Just use columns and cells to create a Gantt chart and present your project with details like tasks and timelines.
Step 1. Create a blank PowerPoint presentation. Select a slide, click on the Insert tab from the top bar, and choose Table.
Step 2. Select the number of columns and rows to create a table. The number depends on the task loads and duration of your project. Click on the Insert button to add a table.
Step 3. Highlight the first column and click on the Layout tab on top. Adjust the widths of columns to 2.13. Highlight the rest of the columns and adjust their widths to 0.9.
Step 4. Add time labels to the chart, for instance, week 1, week 2, etc. Meanwhile, merge the top columns and name them as month 1, month 2, and so on. You can color the time labels as you see fit.

Step 5. Add your project tasks to the first row. Color the rows with your preference.

Step 6. Click on the Insert tab on top to see the drop-down menu of Shapes. Choose the Arrow: Pentagon. Insert multiple arrow shapes as the indicators for task progress.

Step 7. Drag shapes to fit the project task's start and end dates. Go to the Shape Format tab on top and choose Shape Fill to color the arrow shapes.

Step 8. Click on the Insert tab on top and the Icons button. Choose the Flag icon and insert it in the Gantt chart for a milestone.

How to Create a Gantt Chart in PowerPoint from a Template
Besides making a custom Gantt chart, PowerPoint offers multiple templates that let you create a chart more efficiently. You don't have to start from scratch and these templates are ready-made charts with a set look and style.
So, how to insert a Gantt chart in PowerPoint with preset templates? Check out the steps below.
Step 1. Head to the Office Timeline tab from the PowerPoint ribbon. Click on New to open a gallery of templates in different styles. Choose your preferred template to proceed.

Step 2. Go to the Data Entry wizard. Enter your task details or copy and paste the entire Excel sheet. You can change the shape or color here as you like.

Step 3. Your Gantt chart will be generated instantly. Now you can restyle and customize the chart with Office Timeline; for instance, you can edit data, time, fonts, task duration, percent completed, milestones, and other details.

How to Create a Presentation with Gantt Chart via AI?
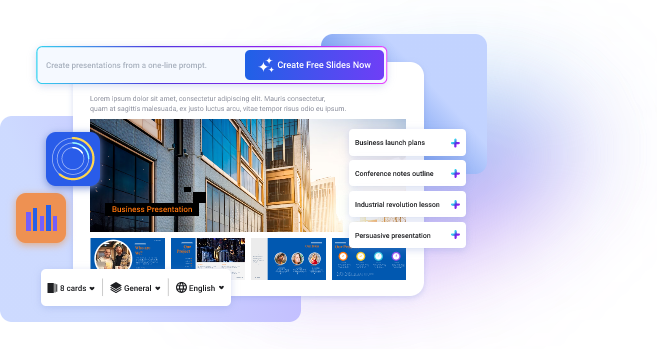
With the step-by-step guides above, you can make a Gantt chart in PowerPoint for your project easily. Want to make a vivid project management presentation? Try Vidwud AI PowerPoint Generator. The AI-enabled presentation maker can help you create stunning presentations based on a one-line text prompt. Whether you want to craft slides for project management or insert your Gantt chart into professionally designed slides, the AI PowerPoint generator can help you make it! It is one of the most reliable tools to create PowerPoint online for free.
Free AI Presentation Maker - Text to PPT
-
Easy and free prompt-to-slideshow generator
-
Multiple themes & templates for beautiful PPT creation
- Perfect online slideshow for school project, business pitch, etc.
Make AI Presentation Now
Have a look at its highlighted features for presentation generation.
-
Turn text into slides instantly
Enabled by the most sophisticated AI, Vidwud allows you to generate slides from text only. How to create a presentation with AI? The entire process is completely automated. Just input a one-line prompt to describe the slides you want, and you can witness the magic instantly.
-
Make presentations in different styles
It supports PowerPoint creation in various styles, for instance, business, project management, education, and so much more. By creating project management slides, you can communicate project plans and progress to stakeholders and team members in a better way.
-
Choose from specially designed themes
Vidwud is the best PowerPoint alternative for good reasons. You can choose your preferred theme to generate slides with consistency in tone and branding. No design skill is needed. Just pick a theme, and the AI presentation maker will craft slides with beautiful layouts and design elements that match the defined theme.
-
Enhance presentation with editing tools
While Vidwud automates much of the creation, you can still customize your presentation the way you like. With the built-in editing tools, you can add text and shapes to polish your presentations. There is also a rich stock media library to insert royalty-free images easily.
Vidwud AI PowerPoint Generator features an intuitive interface that allows you to create killer slides in a few clicks, no skilled needs. Next, let's witness the magic of AI to generate presentations quickly and easily.
Step 1. Go to Vidwud and sign in your account.
Make AI Presentation Now
Step 2. Enter a text prompt to describe the project management presentation you want to create.
Step 3. Define how many cards you need for the presentation, scenarios - for example - Business Plan, Teaching Materials and more, and language.

Step 4. Select a preferred theme. Preview the style and generate slides.

Step 5. Slides with multiple cards will be generated instantly. Click on the Edit button to proceed.

Step 4. To edit the presentation, just use the editing tabs on top to add text, images, or shapes. You can also add more cards to insert your Gantt chart.

At last, you can download and share the presentation as well as update it at any time.
Conclusion
How to make a Gantt chart in PowerPoint? This post has introduced two useful methods. You can create a Gantt chart manually with the Table function or go with the pre-designed templates. Alternatively, you can use Vidwud AI PowerPoint Generator to make a project management presentation. Powered by the most advanced AI algorithm, Vidwud is the most practical tool that lets you generate beautiful slides online for free. You can craft slides for any use case hassle-free.
Free AI Presentation Maker - Text to PPT
-
Easy and free prompt-to-slideshow generator
-
Multiple themes & templates for beautiful PPT creation
- Perfect online slideshow for school project, business pitch, etc.
Make AI Presentation Now


![Best 5 Online AI PowerPoint Generator from Text [2025]](https://cdn.vidwud.com/blog_files/20250114/best-online-ai-powerpoint-generator-from-text.png)


![How Do I Create an Org Chart in PowerPoint? [Solved]](https://cdn.vidwud.com/blog_files/20250314/how-do-i-create-an-org-chart-in-powerpoint-easily.jpg)